Breakpoints in firmware, in a browser tab
Category: Engineering
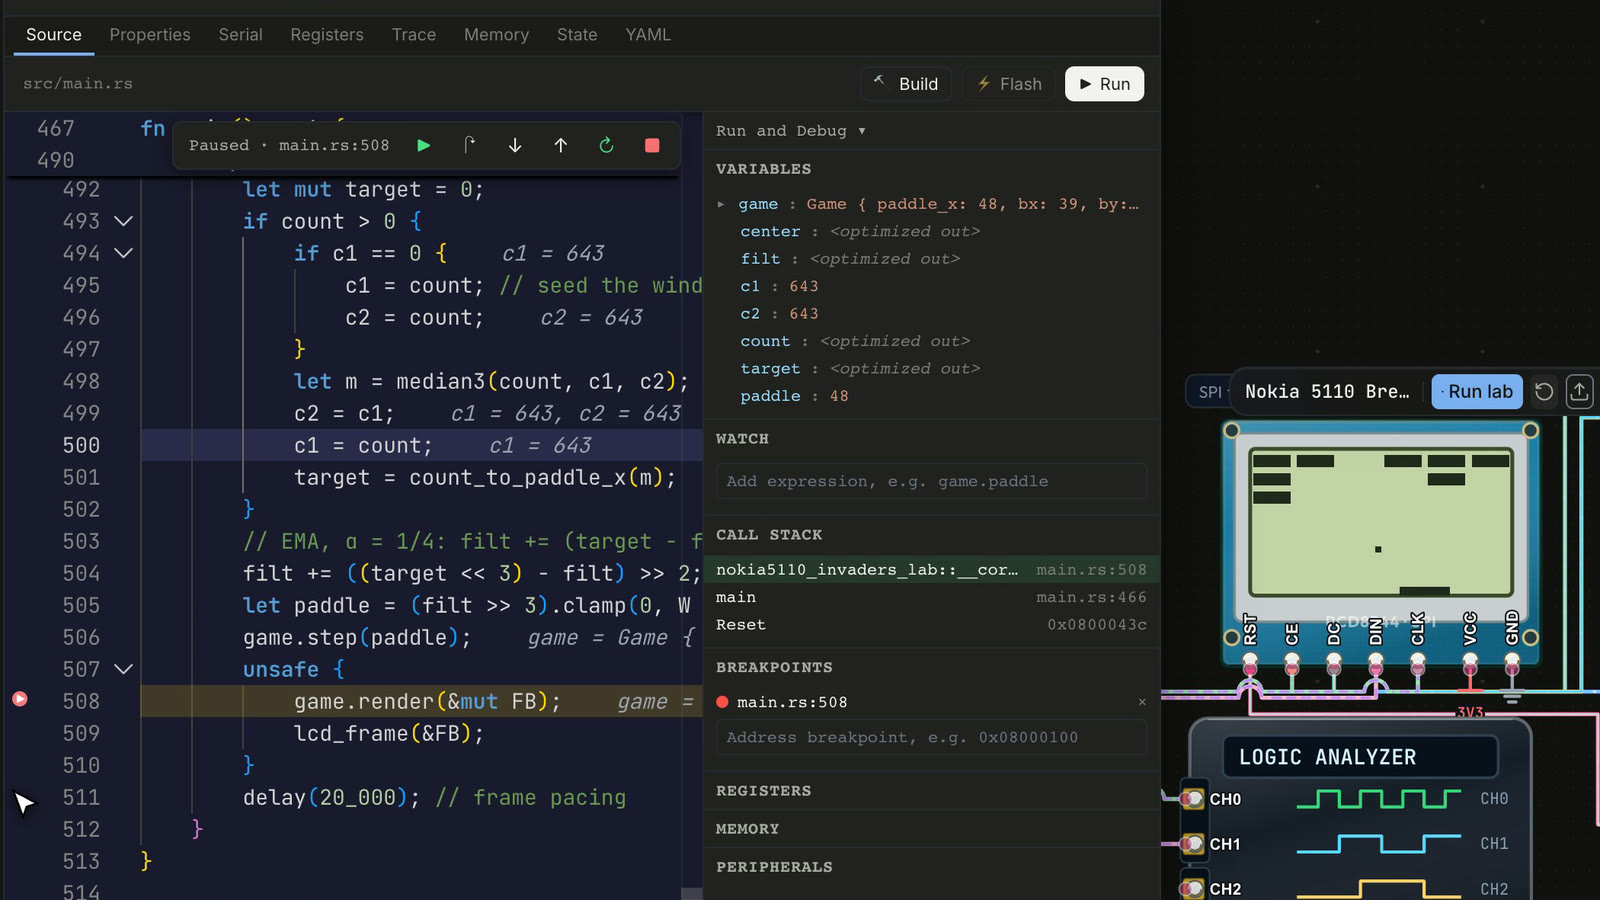
To debug firmware you usually need the board, a probe, the right GDB, and a config file that worked last month. We wanted the part that matters without the rest: click a line, run, and the device stops there. Now it works in the playground. The simulated board pauses on your line, the LCD freezes mid-frame, and the variables show what the code sees.
What it looks like
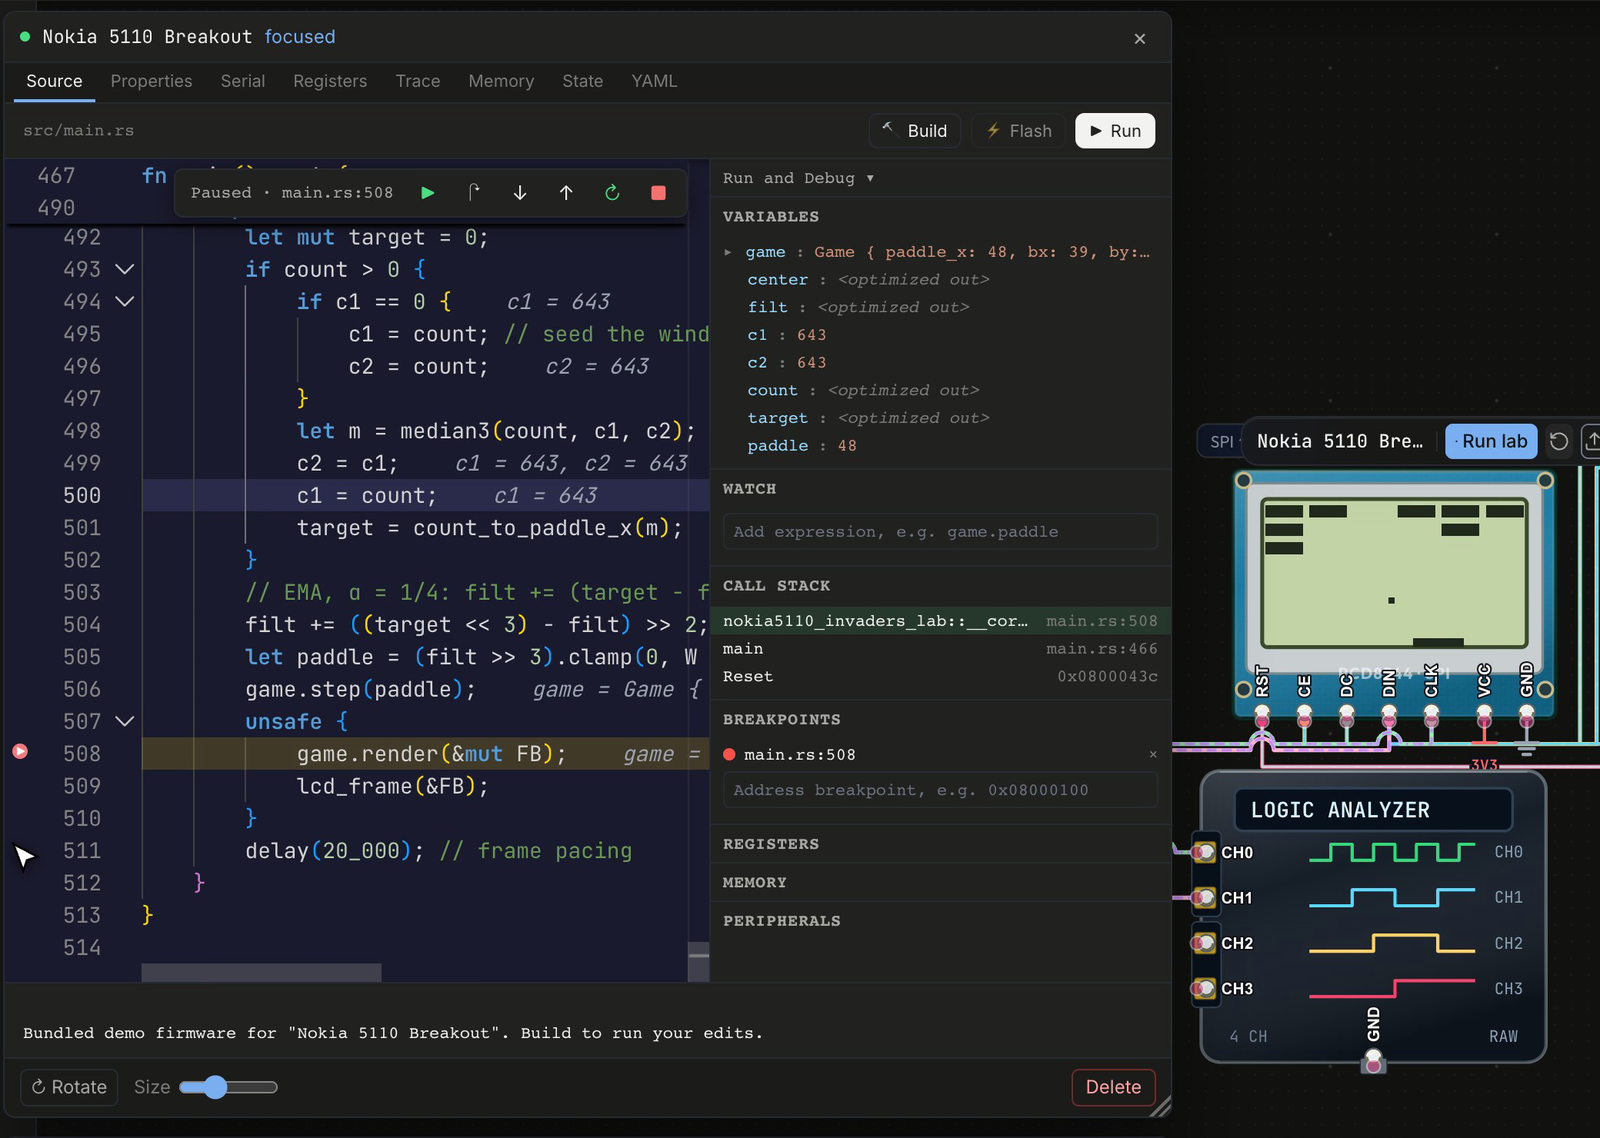
The example is a small game on a Nokia 5110 LCD, with an HC-SR04 distance sensor as the controller. Move the distance slider and the paddle follows. Click the gutter next to the game loop and a red dot appears. The next time the loop runs, the board stops on that line.
Everything is in the code view, the way it is in VS Code:
- Click the gutter to set a breakpoint. The current line is highlighted.
- Use Continue, Step Over, Step Into and Step Out from the toolbar, or F5, F10, F11 and Shift+F11 while the code view has focus.
- Read the Variables, Watch and Call Stack panels next to the code, with Registers, Memory and Peripherals below them. Values also show inline, at the end of the line.
Step Over from line 508 goes to 509, then 511, then back to the top of the loop at 491. Press Continue and the board stops on 508 again, one frame later. Remove the breakpoint and the game runs again.
What we fixed
Variables that said “optimized out” but were not. A release build keeps most locals in a register or at a fixed place on the stack. DWARF describes where with a small expression program. Our reader ran only the first operation of that program. So game, which lives 24 bytes above the stack pointer, showed as “optimized out”, and so did target, which the compiler folded into a constant. The reader now evaluates the whole expression: register and frame offsets, constants, pieces and location lists. It shows values as a tree of integers, bools, enums, pointers, structs, arrays and Rust enums, so game reads Game { paddle_x: 48, bx: 39, … } and expands into its fields.
We also tried the obvious fix first, lower optimization. It made things worse: at line 508, -O1 and -Og builds had more locals marked optimized out than -O3 or -Os. The firmware you debug is the firmware you ship.
Stepping over inlined code. Release Rust inlines a lot. Step Over used to land inside the inlined function instead of on the next line of the loop. It now steps over inlined calls the way a hardware debugger does. Step Into still enters an inlined function, such as measure, and Step Out returns to the loop.
One place to debug. Breakpoints used to be in the code view while the step buttons and variables were in a separate Debug tab. Now everything is in the code view, and the Debug tab is gone.
Try it
Open the Nokia 5110 example in the playground. The code view opens on src/main.rs. Click the gutter left of line 508 and the board stops there. You do not need an account.
What it does not do
- It debugs the simulated board, not a physical one. For real hardware, use your probe.
- Some locals really are optimized out at a given line, such as
filtat 508. The debugger says so instead of guessing. - Source debugging works on the ARM Cortex-M boards and on the ESP32, ESP32-S3 and ESP32-C3. The firmware needs DWARF debug info.