A capacitive touch sensor you can run in your browser
Category: Engineering
A touch pad can detect a finger by measuring how long a small electrical charge takes to build up. The circuit is simple: two microcontroller pins, a large resistor, and a conductive pad. The interesting part is the connection between that charging curve and the firmware reading it.
This LabWired lab makes that connection visible. An Arduino Nano runs compiled CapacitiveSensor firmware against simulated electronics. Press the pad, watch the oscilloscope, and read the number the firmware sends over Serial.
Try the touch pad
The frame below is an interactive lab. Press and hold the touch pad with your mouse or finger. The D13 LED should light. Release the pad and watch it turn off again. If the lab is paused, press Run first.
The oscilloscope tool shows the two probe channels. Open Serial to see the firmware’s total= readings.
The circuit
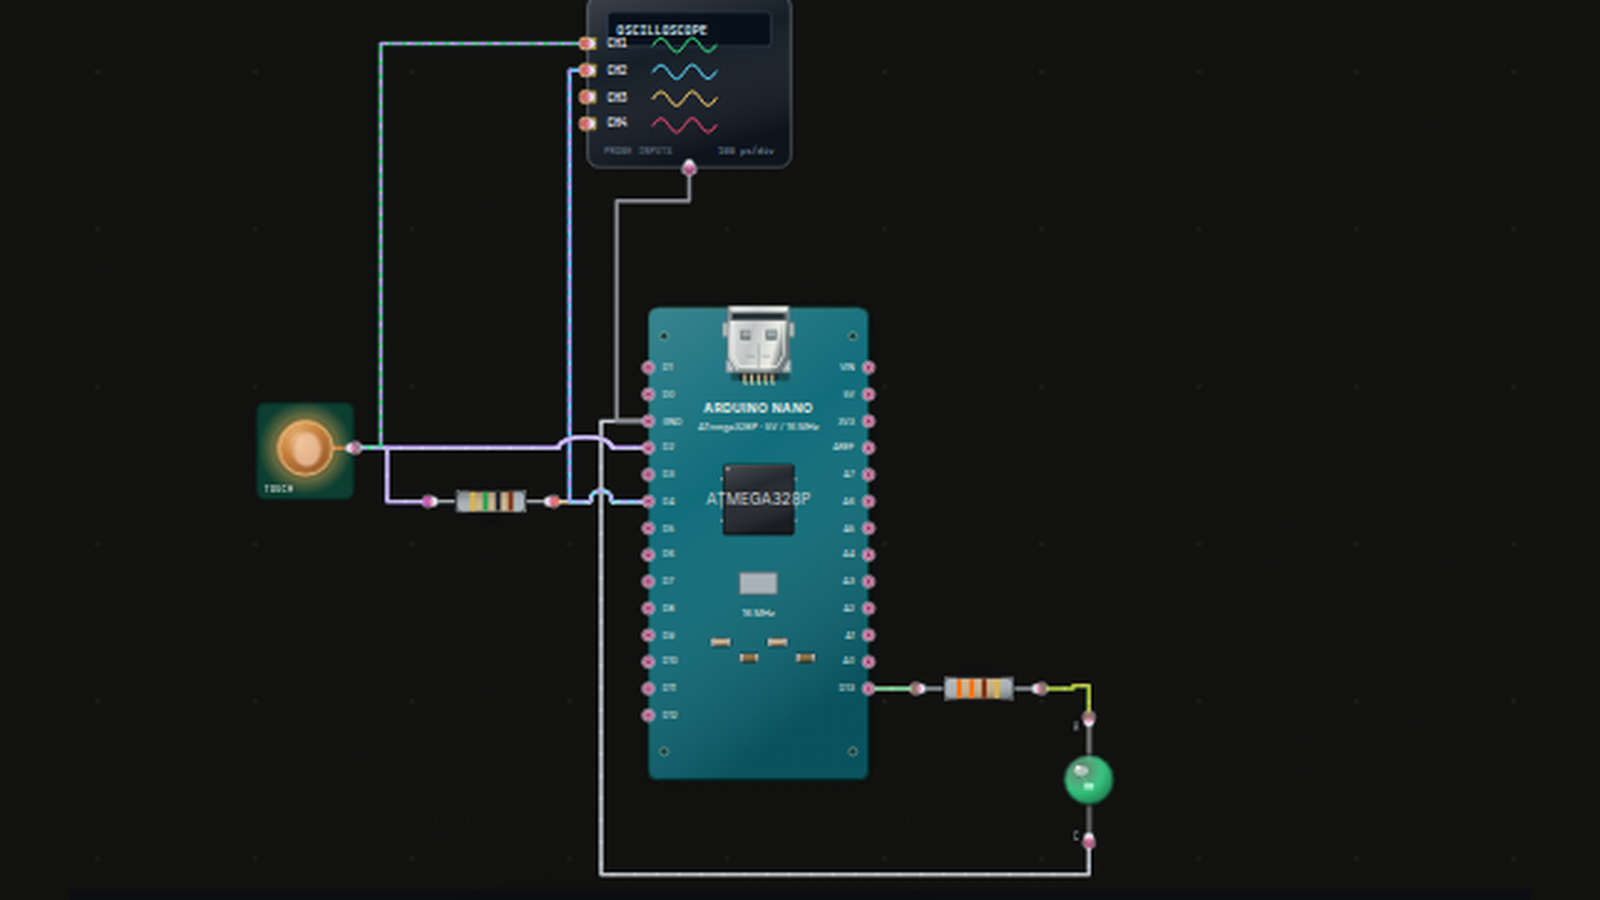
The Nano’s D4 pin sends the charging signal. A 1 MΩ resistor connects D4 to the touch-pad node, which is also connected to D2. D2 is the receiving pin.
| Connection or part | Value and role |
|---|---|
| D4 → R1 → D2 / touch pad | 1 MΩ resistor between the send and receive pins |
| Touch pad → ground | 20 pF pad capacitance |
| Switched finger branch | An additional 100 pF, connected while the pad is held |
| D13 → resistor → LED → ground | 330 Ω series resistor for the indicator LED |
| Scope CH1 | D2 / touch-pad voltage |
| Scope CH2 | D4 / send-pin voltage |
The model includes the microcontroller’s pin direction and drive state. The firmware can discharge the receiving node, release it as an input, and then measure its response to the sending pin. Holding the pad changes the electrical model that this same firmware observes.
What the firmware measures
The sketch uses the open-source CapacitiveSensor library, pinned to commit aa0184827c. It is adapted from the library’s example to use one sensor and a D13 indicator.
The central call is:
CapacitiveSensor cs_4_2(4, 2);
long total = cs_4_2.capacitiveSensor(30);
The library changes the pin states and counts the work needed for the receiving pin to cross its input threshold. The sketch prints the result and compares it with an LED threshold.
In this lab’s observed runs, released readings were around 5, and held readings were around 3,042. These are timing counts produced by the library. They depend on the circuit, library settings, and simulated execution; the useful observation here is the clear change between the two states.
Read the waveform
CH2 shows the sending pin switching. CH1 shows the touch-pad voltage responding through R1. With the additional finger capacitance connected, the pad takes longer to charge. That longer transition gives the firmware a larger count.
You may notice a wider gap after every 30 measurements. The sketch prints the result to Serial between batches. In a comparison run, removing those prints shortened that gap while the recorded samples stayed continuous. The scope is showing time spent by the firmware between measurements.
Try 500 µs/div to inspect a wider time window. Changing the timebase or trigger changes the scope display while the simulation keeps running. You can compare the charging curve with the Serial readings without restarting the sketch.
Change the firmware's decision
The sketch starts with:
const long THRESHOLD = 1524;
To try a source change, open the full lab and sign in to compile your edits. Find this constant in Source and change 1524 to 4000. Build the edited sketch, then Run the resulting firmware.
With the same circuit and readings, the LED should now stay off even while you hold the pad: a reading near 3,042 is below 4,000. Serial should still show the count increasing when you press and decreasing when you release. Restore 1524, build again, and run to bring back the original LED response.
This experiment separates sensing from the decision made with the result. The simulated electronics still respond to the pad. Your compiled firmware decides whether that response is large enough to light the LED.
What this demonstrates
The compiled Arduino program runs on a simulated ATmega328P. Its GPIO activity drives the analog circuit model, and the resulting voltage feeds back into the firmware through D2. The LED and Serial output come from that program. This example demonstrates the firmware and circuit working together; it does not validate a physical touch sensor or every Arduino library. Real pad geometry, wiring, noise, and a person’s connection to ground can change the readings.